Bitcoin Network Analysis
Experiments with Non Fungible Tokens (NFT) HERE
Summary
In late 2017 Bitcoin, btc, was gaining popularity as the major cryptocurrency and many began to acquire and exchanges the cryptocurrency. One of the draws of btc and other cryptocurrencies is the anonymity that is afforded to the those involved in transactions. While all transactions are public and recorded on the blockchain only addresses and accounts are visible. Peoples identities can be detracted from a particular address. In addition, wallets allowed users to generate new addresses at, virtually, any time.
During this period, in 2016, sources claimed that the number of btc users was growing exponentially. This trend was also extrapolated to the number of btc transaction that occurred on the blockchain. However, during this time btc was still not respected as an actual currency and it was difficult to exchange it like money. As a result we expected to see many users but few interactions between them. In this project I took snap shots of the blockchain and performed network analyses to characterize the network, behavior, and explore hypotheses and claims made about the network.
Contributions
 |
Using a websocket API provided by Blockchain.info I was able to sample blockchain transaction data which included, sender/receiver addresses, amount, hash difficulty, etc. I was only concerned with the sender, receiver, and the amount of btc sent. I took three samples of the network which included a one, two, and six hour sample. The data, containing a little over 13,000 records was parsed and converted into a .graphml file for analysis. Using the igraph package with R I looked at the following network characteristics, transitivity, average degree, average distance, reciprocity, degree distribution, and maximal cliques. In addition, on the largest network, I evaluated community structures.
 |
The graph file was then ported over to Gephi mainly for visualization purposes. Network analysis was also performed with Gephi because previous experiences taught me that Gephi metrics vary slightly from those gather by igraph. Gephi and igraph sometimes, for certain network metrics, utilize slightly different algorithms and thus, different values result. Gephi helped with the visualization of influential players in the network as well as community structures.
Learned
From my work on this project I was able to analyze the btc network and characterize it. More importantly, I was able to develop skills in working with API’s, parsing large data, analyzing that data, and presenting it with visual aids such as igraph and Gephi. These skills are applicable in many other situations that require the gathering, analysis, and presentation/visualization of large amounts of data. R is a powerful statistics tool and I foresee my skills with it being useful in my pursuit toward data driven research. Networks are ever present and being able to recognize and analyze them is an important skill.
Support future research

BTC address:
1MU21L4Niyss1HoPeaYgkNT8vn5meJrYeD
Abstract
The purpose of this work was to perform a network analysis on the rapidly growing bitcoin transaction network. Using a web-socket API, we collected data on all transactions occurring during a six hour window. Sender and receiver addresses as well as the amount of bitcoin exchanged were record. Graphs were generated, using R and Gephi, in which nodes represent addresses and edges represent the exchange of bitcoin. The six hour data set was subsetted into a one and two hour sampling snapshot of the network. We performed comparisons and analysis on all subsets of the data in an effort to determine the minimum sampling length that represented the network as a whole. Our results suggest that the six hour sampling was the minimum limit with respect to sampling time needed to accurately characterize the bitcoin transaction network.Anonymity is a desired feature of the blockchain and bitcoin network however, it limited us in our analysis and conclusions we drew from our results were mostly inferred. Future work is needed and being done to gather more comprehensive data so that the bitcoin transaction network can be better analyzed.
1 Introduction
The invention of the internet has helped to provide a new platform for the exchange of money by providing the framework to connect individuals from all around the world. Most monetary exchanges over the internet occur with the help of third party entities such as banks or credit card companies. These third party entities often have oversight over all transactions and are responsible for verifying the integrity of transactions [12]. Exchange protocols, which require a verifier, have become the conventional method of exchanging money over the internet. While these conventional exchange methods account for a good amount of the daily transactions around the world, there are a few draw backs that present problems to many users. Third party verifiers constantly receive a high volume of transactions which need to be verified before money is permanently moved from one individual to another. Different companies and banks have different methods of prioritizing the order in which transactions are verified. A high number of transactions verifications by a small number of third parity entities leads to a bottle-necking effect which can leave recipients waiting for payments to clear and be received. In an effort to reduce the volume of transactions many third party verifiers require minimum transactions amounts and, in some cases, a small transaction fee. While this may help to mitigate the volume of transactions that need to be verified, it limits the financial freedom of those who participate in conventional exchange methods.
Bitcoin (BTC) is a cryptocurrency that offered a solution to the shortcomings present in conventional exchange methods. Invented by Satoshi Nakamoto, bitcoin is a peer-to-peer payment system in which payments are validated by math rather than trust [9]. In other words, instead of trusting a potentially nefarious third party entity, transactions are verified by a proof of work algorithm which involves block hashing [9,11]. A public ledger, known as the blockchain, is created as a result of the hashing algorithm and it contains every transaction in the history of the network. New blocks are hashed about every 10 minutes and transactions are verified and added to the ledger indicating a successful transfer of bitcoin from one individual or entity to another [9]. Anonymity is preserved by keeping user addresses separate and abstracted away from personal information. In addition, there are some instances where a particular user's wallet can generate new sending and receiving addresses to further maintain a level of anonymity [2, 9].
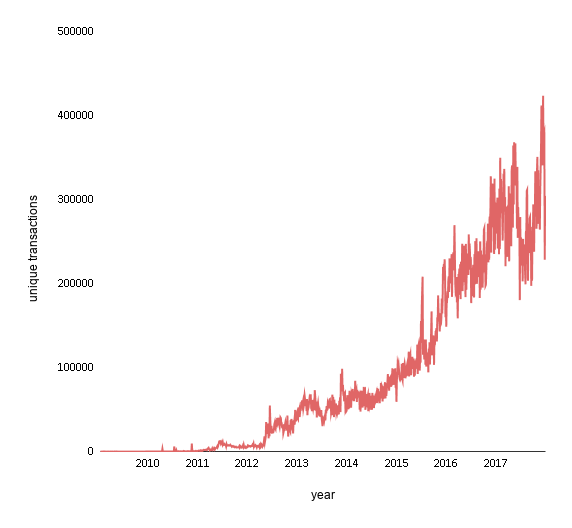
Since its genesis, bitcoin has gained popularity and traction. As a result, the number of bitcoin addresses and the number of transactions have continued to increase at an exponential rate as seen in Figures 2. In this paper, we analyze different snapshots of the growing bitcoin network. Since the bitcoin network is currently large and continuously growing, we are interested in investigating the appropriate network sampling time frame. Network and graph analysis have been performed on the bitcoin network however, its rapid growth may indicate a need for a better way of characterizing the network at a specific point in time [6]. Determining a sampling criterion would allow analysis to be done on a smaller sub-graph from which, conclusions can be drawn and extrapolated to the network as a whole. Running a network analysis on a representative sub-graph would be more efficient and computationally favorable than the whole, growing, bitcoin network.
Number of
transactions over time grows as an exponential function
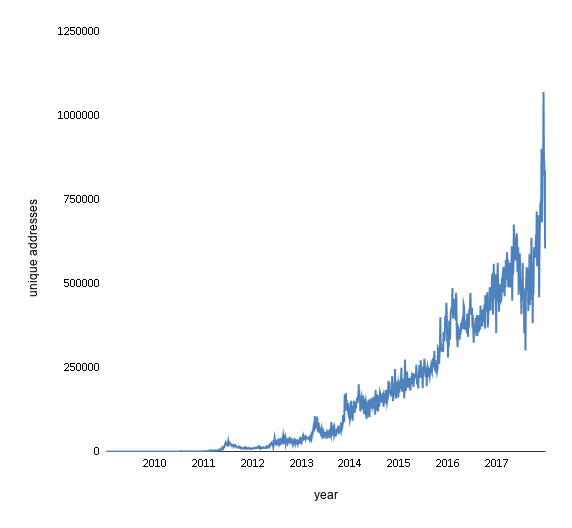
Number of
unique Bitcoin addresses growth over time
The remainder of the papers is as follows: in Section 2 we describe how data is collected, how we generate graphs from that data, and how we use specific tools to analyses the network. In Section 3 we report our finding at different sampling intervals. Lastly, we discuss our findings and conclusion in Section 4.
2 Methods
BTCs are constantly being exchanged and moving throughout the network and as a result the numbers of transactions are ever growing. The number of users and addresses are also constantly increasing. Every transaction involving BTC is public and every transaction since BTCs inception in 2009 is recorded on a public ledger. This is a unique feature of BTC and every node participating in the network has a copy of this public ledger. This ledger is constantly being updated as new transactions are confirmed. Updates occur on every ledger on every node participating in the network and thus every node is in consensus with each other on the current status of the ledger.
While we could have joined the blockchain network and downloaded a copy of the public ledger to build our network graph, we felt that it would not be an efficient method of evaluating the current status of the BTC network. As a result, we decided to utilize a web socket API from BlockChain.Info. This API allowed us to stream live transactions as they were on their way to be confirmed. Each transaction came in as a JavaScript Object Notation (JSON) file and a script was written to extract and parse out the sender address, receiver address, and the BTC amount variables. These variables were stored as a comma separated file (.csv). The web socket ran for a total of six hours and separate csv files were generated at the one hour, two hour, and six hour time points; hence the snapshots. One of our objectives was to investigate possible changes in network characteristics with different sample sizes and durations. In other words, we are interested to see if any network metrics change as the network grows within our sampling snapshots. It is important to note that the web socket performed a continuous data collection and was not interrupted when the one hour and two hour samples were taken. The resulting one hour and two hour samples are sub sets of the six hour sample with the one hour sample also being a subset of the two hour sample.
The csv files for the one, two, and six hour samplings were imported into Gephi [4] to generate a graph of the sampled BTC network. The csv files were imported as edge list where the sending address corresponded to the "source" and the receiving address corresponded to the "target". The amount was converted from Satoshis to BTCs, 1 BTC = 1x10⁸ Satoshi, and stored as a float, an edge attribute. Graph files were exported as .graphml for further data processing.
Graph metrics were analyzed with R utilizing the igraph, poweRlaw, and linkcomm packages [5]. Transitivity, average degree, average distance, reciprocity, degree distribution, and maximal cliques were measured for each snapshot graph and compared to each other. The largest connected components were also extracted from each of the three sample graphs and metrics were computed with igraph. The six hour connected graph was further evaluated for the presence of communities. Using the linkcomm package and the getlinkcommunities, by Alex T. Kalinka, we were able to generate community's nodes that linked to every node of a particular community [5]. Investigating community structures in the giant connected component may reveal BTC user financial behavior; in particular who exchanges money with whom.
3 Results
There was a positive correlation between the sampling time and the amount of observed transactions. As mentioned previously in Section 1, the numbers of transactions are increasing at an exponential rate. We plotted the number of edges, obtained in our sampling, over the duration of six hours. Transactions are indicated by an edge in the resulting graph of the networks sampled for one, two, and six hours. The increase or growth of the network resulted in an increase in both the number of transactions, indicated by the number of edges, and the number of active addresses, indicated by the number of nodes. These results are shown in Figure 3.
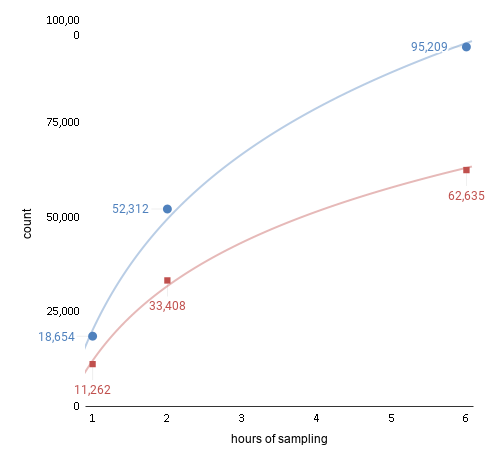
The trend line would indicate that the number of transactions are growing at a logarithmic pace rather than an exponential one. R2 values for logarithmic best fit lines for nodes and edges are 0.997 and 0.996 respectively This is contradictory to what was expected however, this discrepancy may be due to the amount of data and sample size. Blockchain.info reports an exponential growth in the number of transactions over the whole life span of BTC [1]. Our sampling window could be the limiting factor and perhaps, we would start to see an exponential growth trend for a longer sampling duration.
The number of transactions since the inception of BTC has an overall general exponential growth trend but the transaction rate seems to fluctuate if observed form the perspective of weeks and months. There is a level of volatility when it comes to the prices or exchange rate of BTC [13]. Price volatility could correlate to these fluctuations and periods of lower transaction volumes. A six hour sampling window does not appear to be a long enough time frame to model the overall network growth. Since transactions rates can fluctuate for periods of time ranging from days to months, it is best to look at the entire transaction history in order to draw conclusions about the overall growth rate of transactions. A smaller sampling window, such as the 6 hours for which we took our samples, may be useful when analyzing how the network is growing in the near or short term.
3.1 Snapshot Network Analysis Results and Comparisons.
Network analysis was performed on all three graphs with the purpose of investigating changes as the time and the size of the sample network increased as well as for comparison to previously reported findings. Analyzing the difference in resulting graph metrics would help in determining an appropriate sampling window that would yield a sample graph that is representative of the network as a whole. Table 1 contains the metrics calculated for all three network graphs.
| Sampling Duration | 1 Hour | 2 Hour | 6 Hour |
| Nodes | 18654 | 52312 | 95209 |
| Edges | 11262 | 33408 | 62635 |
| Diameter | 12 | 19 | 39 |
| Max Cliques | 3 | 3 | 3 |
| Dyads | 10943 | 32512 | 61122 |
| Tryads | 2 | 8 | 34 |
| Reciprocity | 0.00 | 0.00 | 0.00 |
| Transitivity (global) | 0.00 | 0.00 | 0.00 |
| Transitivity (average) | 0.00 | 0.00 | 0.00 |
| Mean Degree | 1.21 | 1.28 | 1.32 |
| Mean Distance | 1.31 | 1.90 | 5.37 |
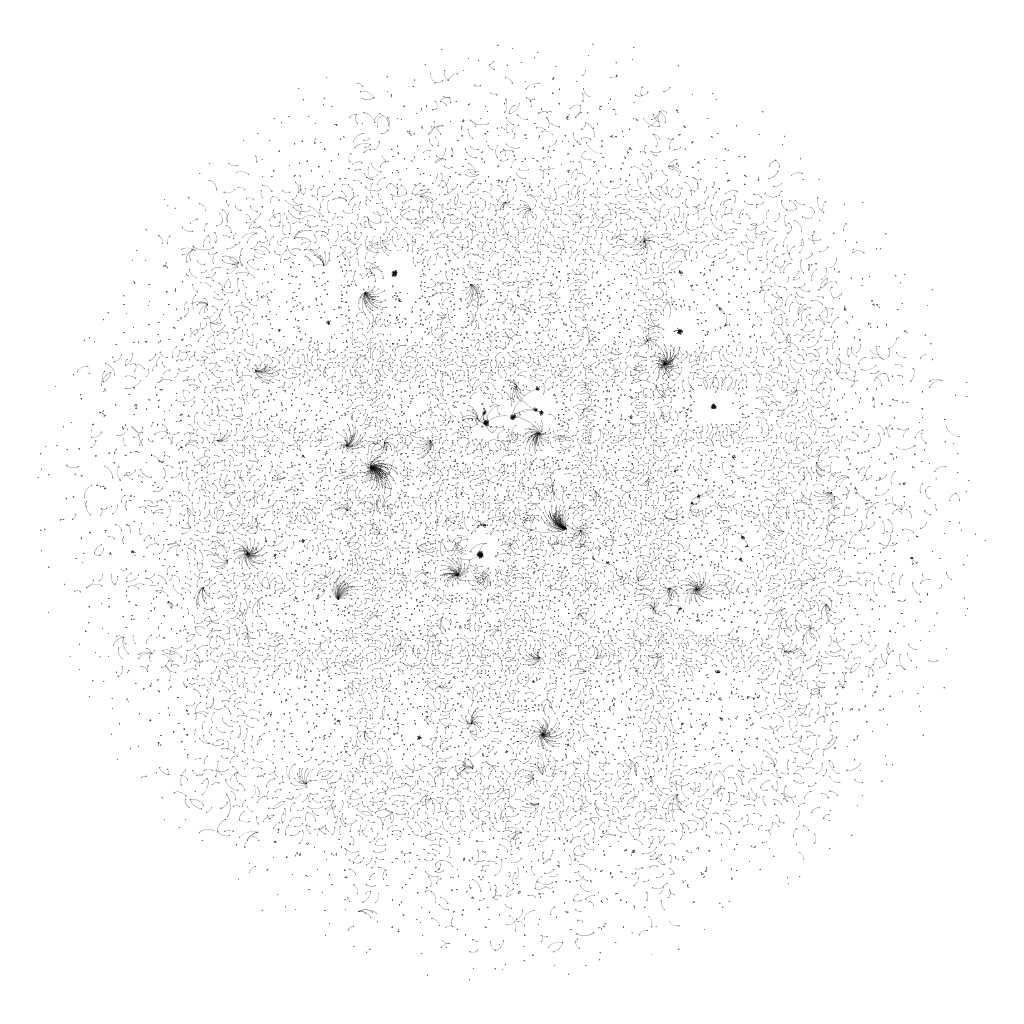
Graph sampling after one hour
Graph sampling after two hours
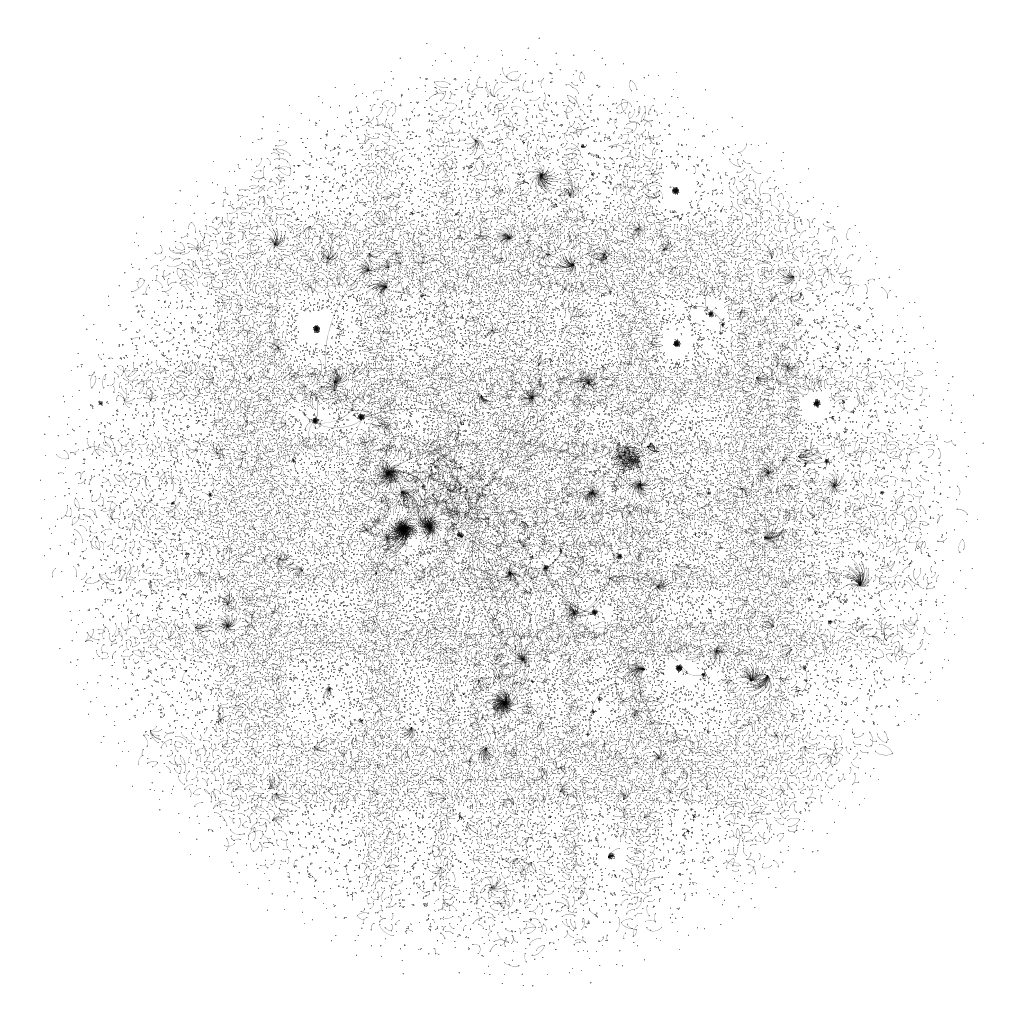
Graph sampling after six hours
Across all three sample graphs, reciprocity, global transitivity, and mean degree were consistent. These metrics changed only slightly as the graph grew over the 6 hours. Transitivity was low for all three graphs, which was to be expected. Transitivity would increase when, for example, someone sent BTC to two separate people and those two people exchanged BTC with each other. This is not a likely event and this is why we expected it to be low. All three graphs had a low mean degree with the largest mean degree value being 1.32 for the six hour sample graph. A low mean degree would help to explain a low transitivity since a low mean degree indicates that the majority of the nodes in a graph have only one edge. Nodes need a minimum of two edges for transitivity. The mean degree values for each graph indicate that most addresses execute only one transaction. The number of dyads implies that the graph is primarily composed of pairs of nodes that share only one edge. For each sample graph, dyads account for the majority of nodes in the network. Triads make up a significantly lesser portion of the graph. We did not expect to see many triads or cliques during our sampling. In the short term, it is unlikely that triads form because it would mean that some money comes back to the original sender implying that some portion of that transaction should not have been sent out in the first place. However, goods or services could have been exchanged among the triad which would explain its formation. The network is built only on BTC transactions and thus we do not know the exact motive behind each transaction. A longer sampling would probably have led to more triads and possibly greater maximal cliques. However, it is just as likely that the number of pairs of nodes would have increased at a similar rate.
Reciprocity was also low. This was expected for this type of network. It is unlikely that a node would reciprocate an edge because that would be like person A sending 1 BTC to person B in the first transaction then person B sending back, to person A, a given amount of BTC in a second transaction. The first and second transaction can be combined into one and the net amount, the difference in the amount between the first and second transaction, should be sent to the appropriate person which would eliminate an edge in one direction. The reciprocity value is small for all graphs but it is not zero which means that there are instance of reciprocating edges. The instances where a user sends the wrong amount to another user who, is kind enough to correct the transaction and send it back to the person it originated from may be an instance for reciprocation. Returning goods and getting a refund on something bought with BTC is another instance that may warrant reciprocation. Reciprocation can also be the result of gambling sites where, gamblers gamble in BTC and earn their winnings in BTC too. These instances are rare and small in comparison to the vast number of transactions constantly being received. The rarity of reciprocity is reflected in the zero value obtained for all sample graphs.
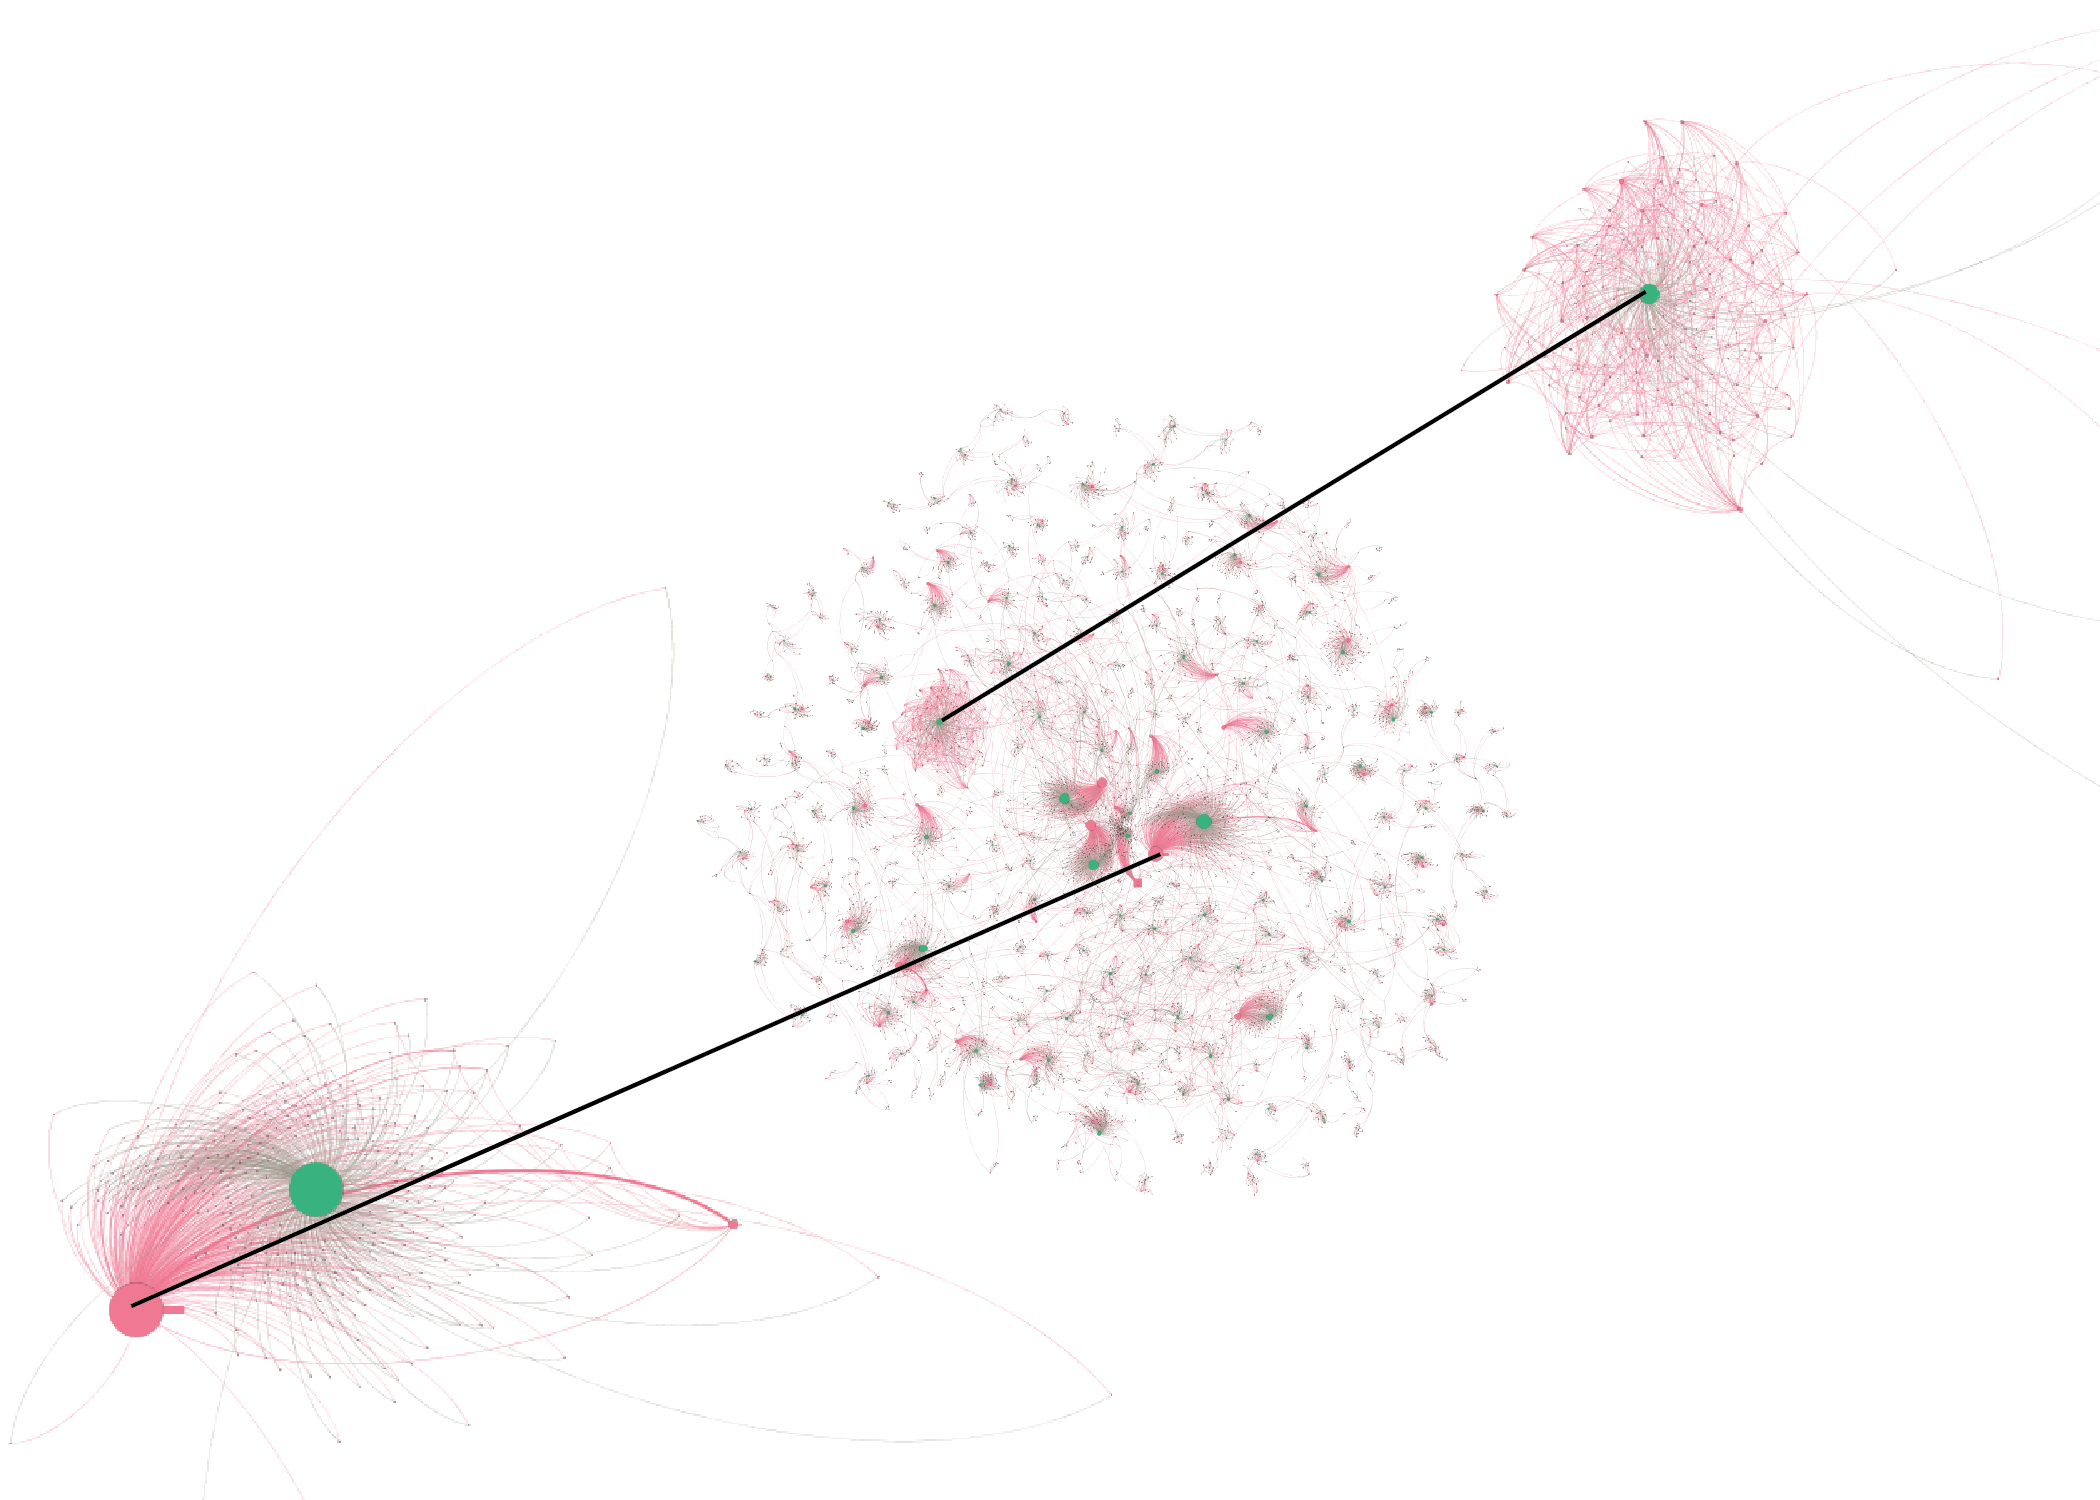
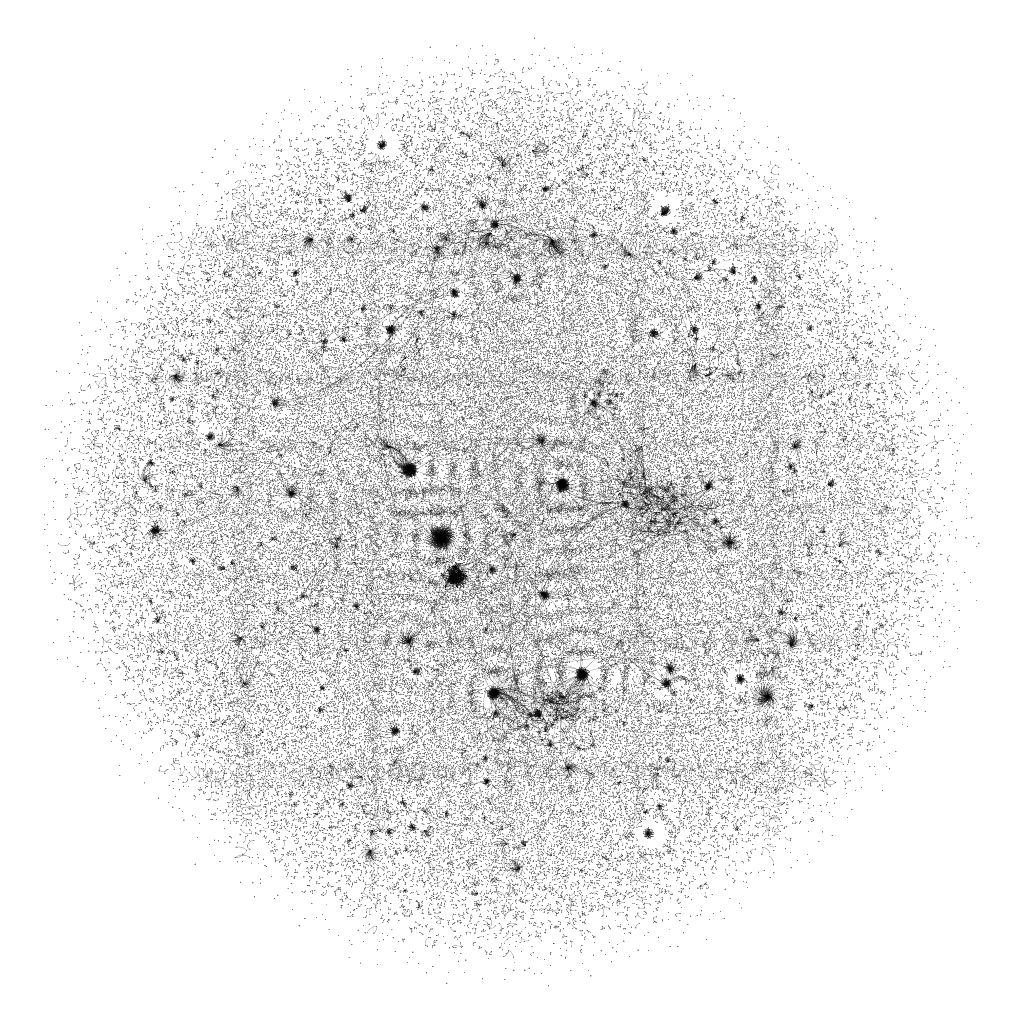
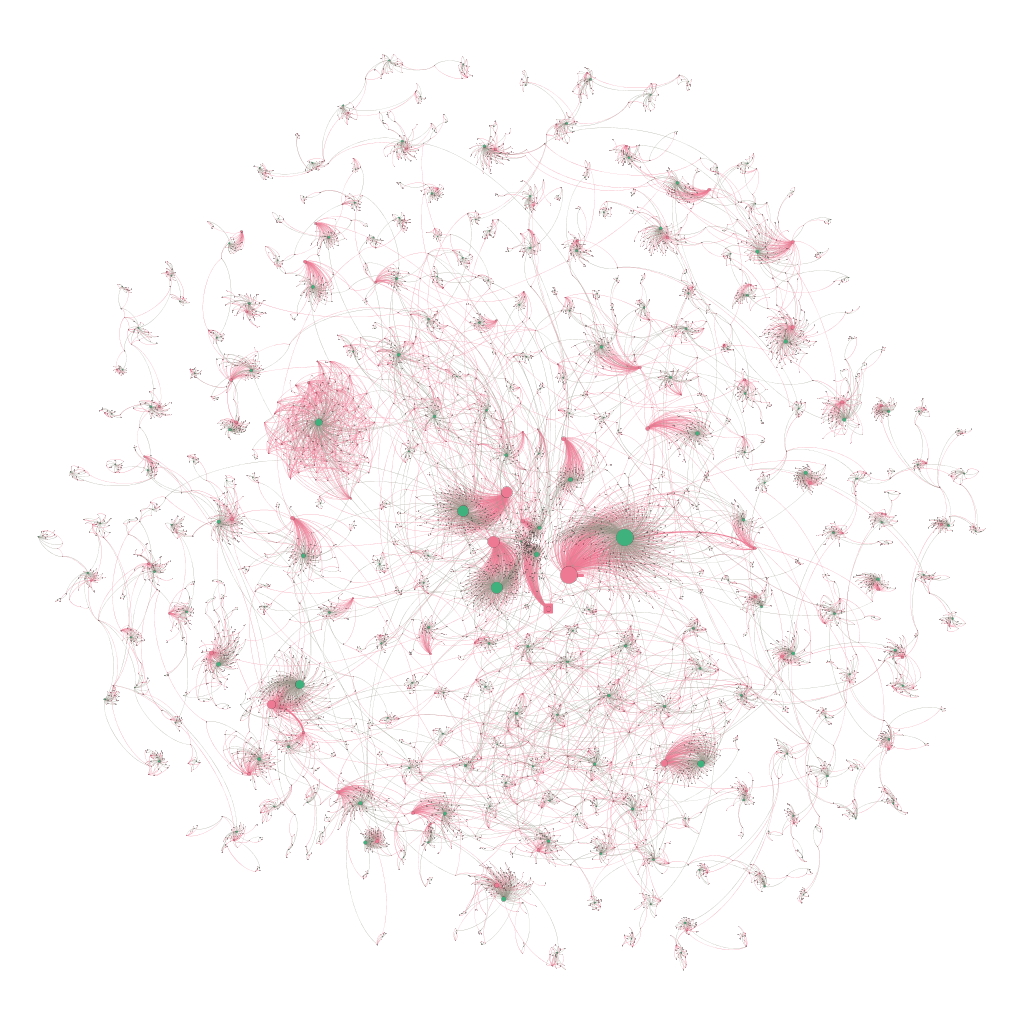
Visual representations of each samples size graph, density, and connections are show in Figure 5. The density of the graph increase as sampling time increases. Dark black spots are star like structures consisting of clusters of nods around a single node with a high degree. As time goes on, more nodes form edges to these central nodes which increase the size of the black spots. However, it does not appear that links are formed from one high degree node to another. Nodes with high degree seem to increase their degree as more nodes join the network which exhibits characteristics of preferential attachment and implies a possible scale free network [3, 7].
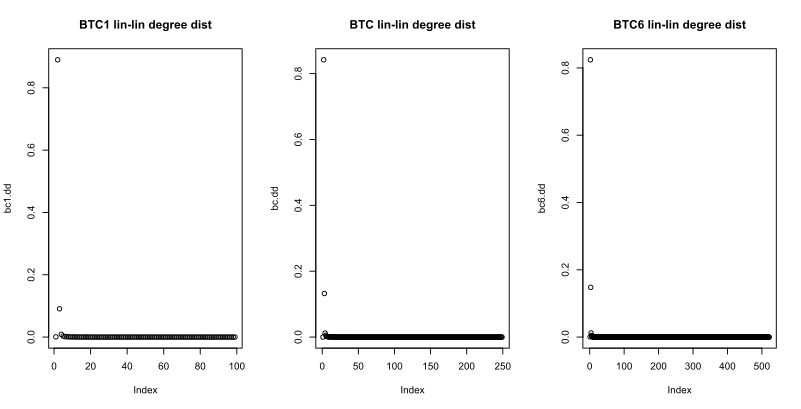

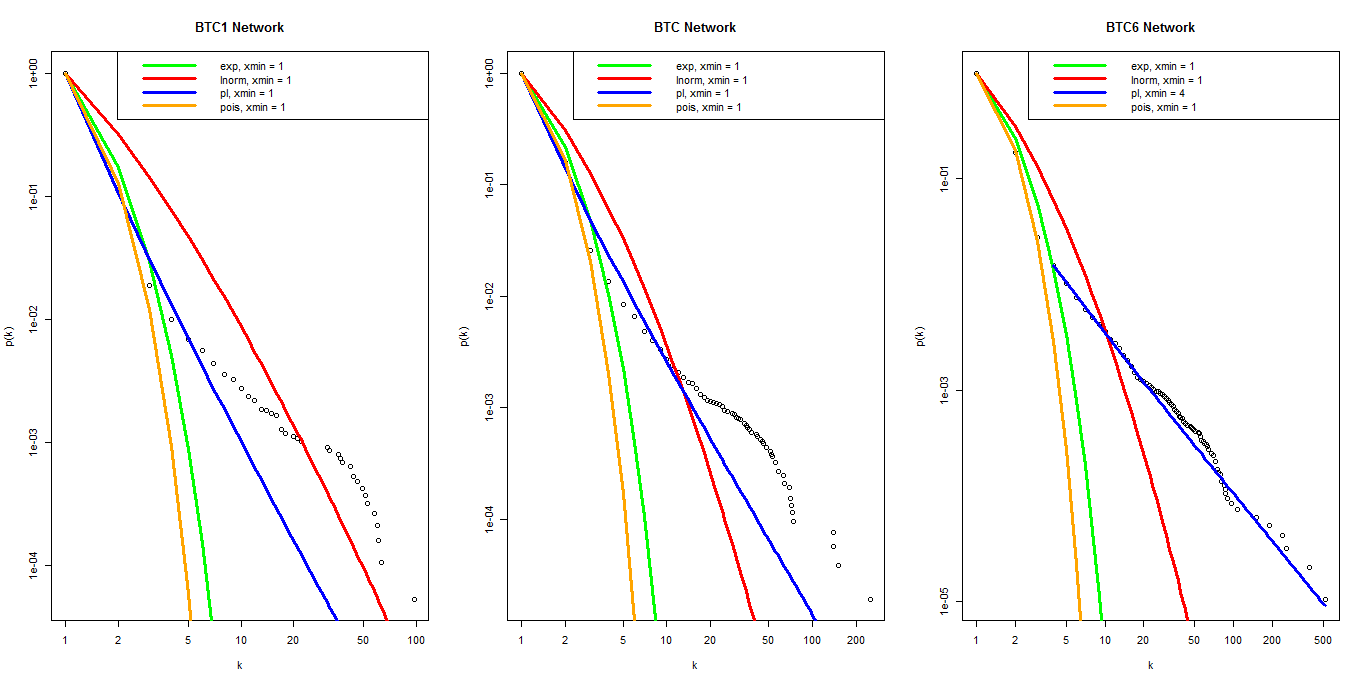
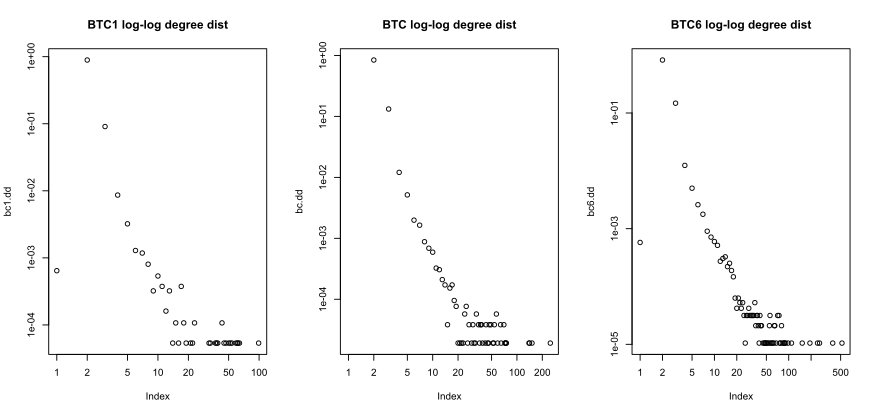
Scale free networks are characterized by having a power-law degree distribution. We investigated the degree distribution in Figure 7. Here we see that the degree distribution for all sample networks is heavily tailed to the right which is characteristic of power-law distributions.
The degree distributions for each graph was plotted in conjunction with exponential, log normal, power law, and Poisson best fit lines. Results in Figure 8 would indicate that the one hour and two hour graphs do not fit any particular trend. However, when Xmin was set at 4, the six hour distribution seemed to fit the power law distribution. Kolmogorov-Smirnov test results in a p value of 0.46 which indicates that we cannot reject the hypothesis that the six hour distribution fits a power law [5].
Evidence of a power law distribution were seen in our largest graph which was sampled for the longest period of time. It would appear that smaller samplings of the network do not resemble a scale-free network however, the largest sampling started to show evidence of a power law distribution which is indicative of a scale-free network. It is likely that a longer sampling window would yield a larger graph in which a power law is more apparent.
Although the graphs are mainly composed of pairs of nodes, we were interested in the presence of communities. We extracted the largest connected component from the sample graphs. This left us with graphs that excluded the many isolated pairs of nodes. Metrics were calculated and are shown in Table 2.
| 1 Hour | 2 Hour | 6 Hour | ||
| Nodes | 238 | 3028 | 9052 | ||
| Edges | 243 | 3193 | 9698 | ||
| Diameter | 4 | 19 | 39 | ||
| Max Cliques | 2 | 3 | 3 | ||
| Dyads | 2 | 3172 | 9582 | ||
| Tryads | 0 | 3 | 20 | ||
| Reciprocity | 0.00 | 0.00 | 0.00 | ||
| Transitivity (global) | 0.00 | 0.00 | 0.00 | ||
| Transitivity (average) | 0.00 | 0.00 | 0.01 | ||
| Mean Degree | 2.04 | 2.11 | 2.14 | ||
| Mean Distance | 1.29 | 3.04 | 6.67 | ||
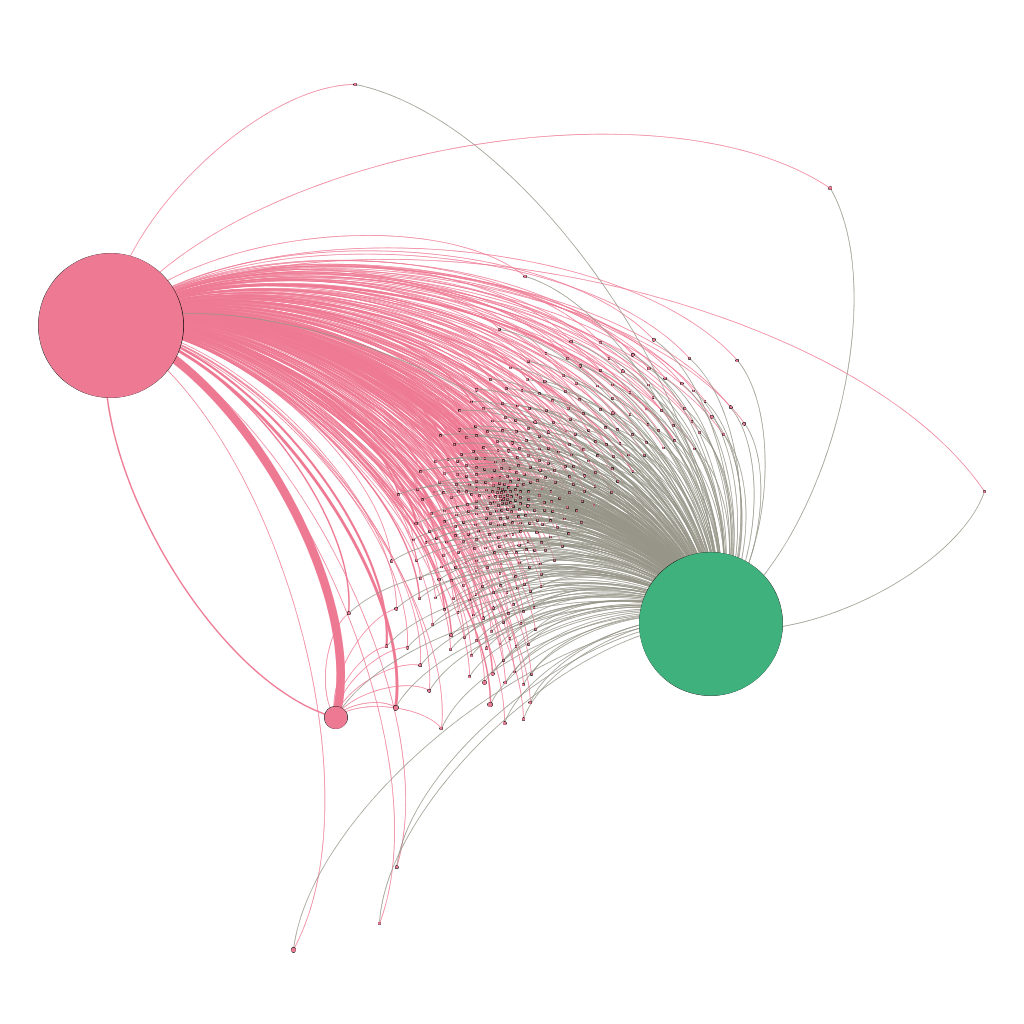
Large community in which many nodes share only one edge
with one of the two main nodes
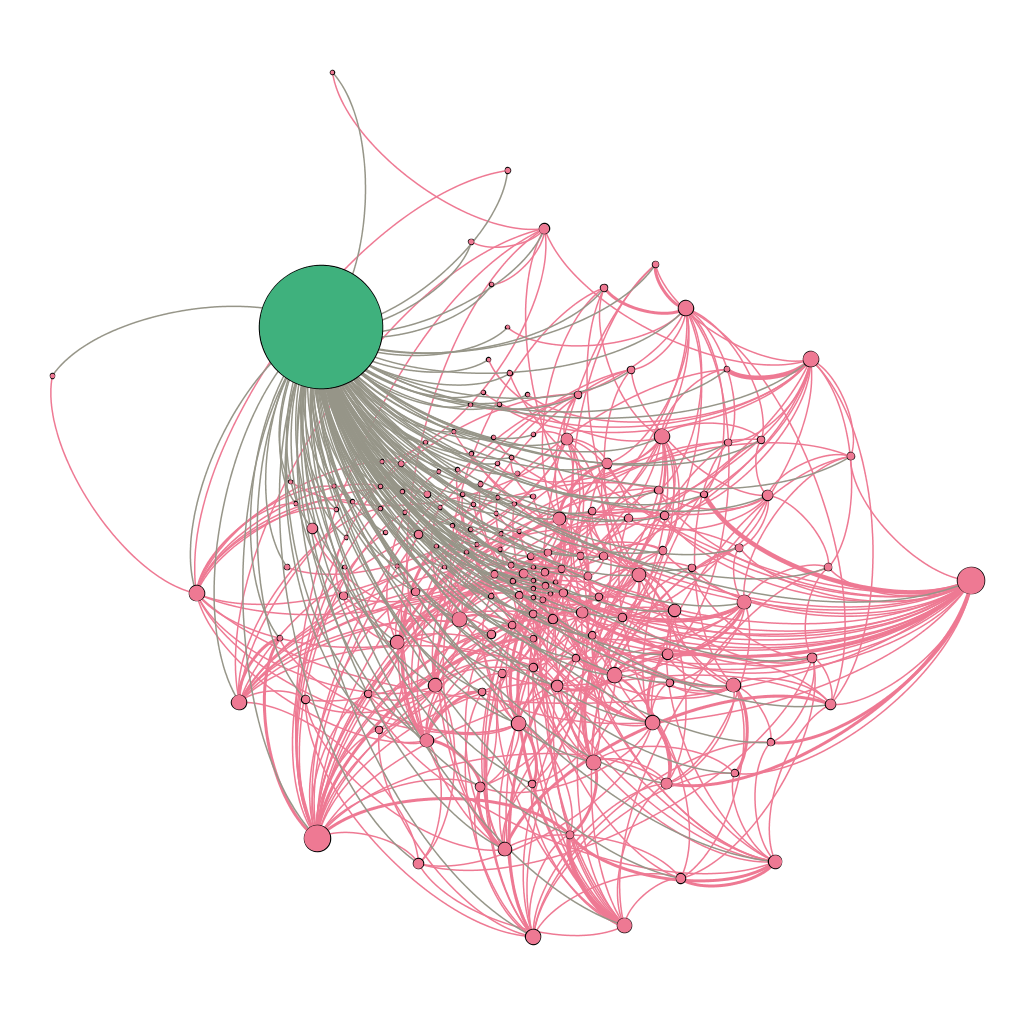
Large community which has a more decentralized shape
3.2 Analysis of Six Hour Snapshot Giant Components.
Directedness was not taken into account when extracting the giant components from each graph. Each sub graph is significantly smaller than its original graph implying again that the graphs are primarily made up of isolated pairs of nodes. This means that, during the sampling window, addresses only sent one transaction. For the giant component subgraphs, the metrics were not consistent across all giant component subgraphs, as seen in the original graphs.
Our analysis showed that the six hour graph showed to be the best representative sample network. Therefore, we chose to run community detection on the six hour giant component subgraph. The resulting graphs can be viewed in the appendix. Figures 10 are sub graphs of the graph, Figure 11, in the appendix.
Both graphs represent the two biggest communities contained in the six hour giant component graphs and they have slightly different structure. Figure 9a illustrates a community in which many nodes share edges with one central node. This creates a star like structure seen in most of the other communities. The second community in Figure 9b does not contain a single node with a high degree. Most of the nodes have the same degree and yet they form a community. This would imply that the nodes are more interconnected to each other, as there is no distinct hub or authority. Figure 9b represents more of a decentralized community.
Community structures provide clues as to what types of individual or entity may be contained within a network. For communities that resemble that of Figure 9a, it is possible that the high degree node may be a type of vendor or a spender depending whether or not there is a high in-degree or out-degree. A high in-degree would mean that one address is receiving a lot of transactions while a high out-degree would mean that an address is paying a lot of other individuals. Figure 9b resembles a different type of community. It is difficult to draw conclusions about the nature of the nodes in this community. Gambling is one possible instance in which many transactions occur among a community of individuals. However, it is also likely this community is a bunch of nodes doing business together. Given that it was a six hour window, it is unlikely that business would execute that many transactions with each other. Further analysis is needed to determine the nature of the individuals but community detection is a good starting point.
4 Conclusion
The six hour sample graph seemed to provide a sample graph that was most representative of the reported nature of the bitcoin transaction network [8]. Modeling the network growth with the one, two and six hour subgraphs did not seem to be a reliable means of evaluating long term growth of the network. Growth fluctuations are experienced in the short term and thus any short term network growth sampling may not be indicative of the network's overall growth.
Sample graphs yielded metrics that we expected to see. Our six hour sample graph showed evidence of a possible power law degree distribution which suggest that we cannot dismiss the possibility that our network is scale-free. The emergence of such correlation was only seen in the six hour graph and not in the two hour or one hour graphs. Further investigations should consider a longer sampling window in order to get a better snap shot of the network. A longer sample window may be beneficial and provide a more definitive distribution.
A deeper investigation into the owners of each address would aid in a more comprehensive analysis of the bitcoin transaction network. Certain security feature most likely lead to some level of skewness in the data set. The feature which allows users to change the sending and receiving address is a powerful security feature but it could lead to a misrepresentation of the amount of actual bitcoin users participating in the network. Since all transactions are kept on a public ledger, addresses associated with a transaction involving a lot of bitcoin may become targets of malicious attacks. Some bitcoin wallets allow users to generate new public addresses in order to maintain a level of anonymity on the network. This feature may explain the large number of pairs of nodes in our network samples. It could be that individuals change their address for every transaction and a new address is used for subsequent transactions. Situations are present where an address cannot be changed or it would be inconvenient and this is why we see nodes with high degrees despite the fact that an address can be changed. For example, if a vendor accepts bitcoins as payment it would be inconvenient for the vendor and patrons if the vendor constantly changed addresses because patrons, especially "regulars", would have to constantly check that the address is current and that they are sending money to the right address.
Individuals are allowed to have multiple bitcoin wallets just as someone may have multiple bank accounts or credit cards. Multiple wallets per individual would lead to a similar phenomenon to generating new addresses however; one more thing needs to be considered. Money can be sent from one wallet to another wallet but one individual may have ownership to both wallets; it is like transferring funds between two bank accounts you own. To acknowledge this transfer the, the network needs to verify it and thus it would show up as a transaction in the network.
Community detection may help to investigate ownership of a particular address because multiple addresses in a particular community may belong to one individual. Combining these addresses would lead to a better resolution of the network. The way it stands now, our network primarily resembles the movement of bitcoin. Building a transaction network in which the nodes represent a single individual or entity rather than a single address would result in a network that would resemble how people spend bitcoin. Separating the identity from the bitcoin address was in the original design of the network to protect individual
[1] [n.d.]. Bitcoin Charts & Graphs - Blockchain. https://www.blockchain.com/charts
[2] Andreas M Antonopoulos. 2014. Mastering Bitcoin: unlocking digital cryptocurrencies. " O'Reilly Media, Inc.".
[3] Albert-Laszlo Barabasi et al. 2016. Network science. Cambridge university press.
[4] Mathieu Bastian, Sebastien Heymann, and Mathieu Jacomy. 2009. Gephi: an open source software for exploring and manipulating networks. In Third international AAAI conference on weblogs and social media.
[5] Gabor Csardi, Tamas Nepusz, et al. 2006. The igraph software package for complex network research. InterJournal, complex systems 1695, 5 (2006), 1-9.
[6] Michael Fleder, Michael S Kester, and Sudeep Pillai. 2015. Bitcoin transaction graph analysis. arXiv preprint arXiv:1502.01657 (2015).
[7] Daniel Kondor, Marton Posfai, Istvan Csabai, and Gabor Vattay. 2014. Do the rich get richer? An empirical analysis of the Bitcoin transaction network. PloS one 9, 2 (2014).
[8] Philip Koshy, Diana Koshy, and Patrick McDaniel. 2014. An analysis of anonymity in bitcoin using p2p network traffic. In International Conference on Financial Cryptography and Data Security. Springer, 469-485.
[9] Satoshi Nakamoto. 2019. Bitcoin: A peer-to-peer electronic cash system. Technical Report. Manubot.
[10] Fergal Reid and Martin Harrigan. 2013. An analysis of anonymity in the bitcoin system. In Security and privacy in social networks. Springer, 197-223.
[11] Dorit Ron and Adi Shamir. 2013. Quantitative analysis of the full bitcoin transaction graph. In International Conference on Financial Cryptography and Data Security. Springer, 6-24.
[12] Don Tapscott and Alex Tapscott. 2016. Blockchain revolution: how the technology behind bitcoin is changing money, business, and the world. Penguin.
[13] David Yermack. 2015. Is Bitcoin a real currency? An economic appraisal. In Handbook of digital currency. Elsevier, 31-43.