Photo Mosaics with Nearest Neighbors: Machine Learning for Digital Art
TLDR
- Machine learning can be used artistically to create photo mosaics
- Modeling with K-nearest neighbors offers a robust method for searching when exact matches are not always possible.
- Checkout the whole catalog of photo mosaic animations
What is a Photo Mosaic
Here’s an example!
Zoom in animation, Recommend watching in full screen
Technological innovation is increasing at a rapid pace and has made digital
storage extremely cheap and accessible. Additionally, most people now have
phones with cameras that are able to capture high quality images. The majority
of images taken are viewed a few times and then sent to sit on a hard drive or
some cloud storage service. This results in people amassing large libraries of
pictures. I am no different and since I had some extra time during the COVID-19
lockdowns, I came up with some software to give the photos in people’s
libraries a second life. This software creates photo mosaics.
A photo mosaic is an image or photo that is created by stitching together many smaller images. In the gif and videos above, it is easy to see how many small image squares are used to create a larger picture. There are several methods for creating these mosaics; for instance, the smaller image squares or tiles can be chosen and placed in the larger image based on color or image structure. In this post, we focus on a color matching strategy and it is of particular interest to a data science or machine learning audience because it utilizes K-nearest neighbors (KNN) modeling approach.
Framing the Problem
As always, it is good practice to deconstruct the problem and build functions around the various components that are needed to accomplish the goal. First we need to divide the larger or cover image into smaller subsections (see Figure 1. below). Once we have the smaller subsections then we can find the image tile that would match each subsection. We are using a color matching method to build the mosaic and thus we can formalize the problem as follows: for every cover image subsection, find a tile image that most closely matches the color.
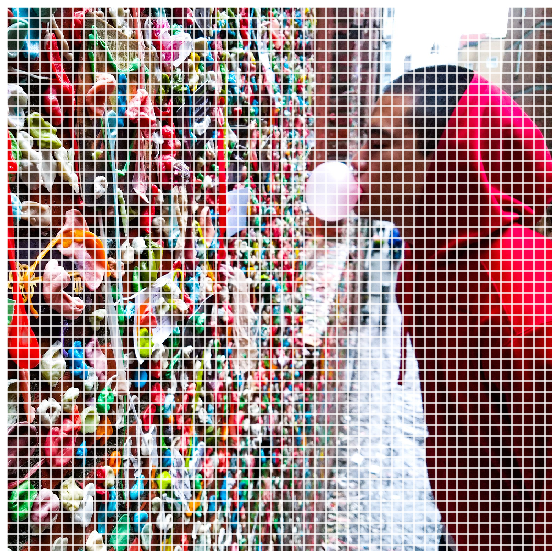
Figure 1: Here we divide our cover image up into square subsections denoted by the white line.
Structure of Color Images
Digital color images are composed of different pixel color channels that when combined create a colored image. A common format is red green blue or RGB image formats in which a colored image is made up of red, green, and blue channels. Images are commonly stored in 8-bits which means that pixel values for each of the color channels range between 0 and 255 (2^8-1).
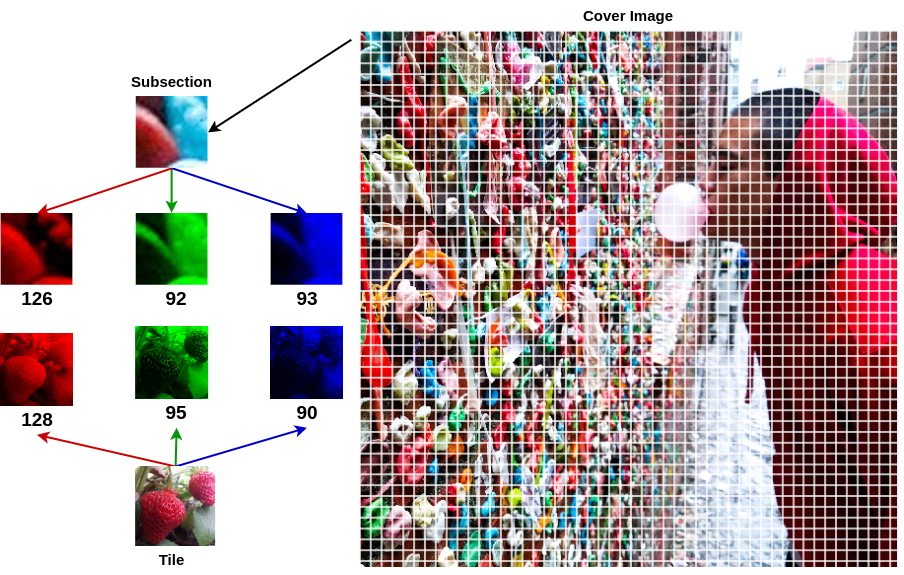
Figure 2: Here we capture the average RGB values for both the subsection (top) and the tile (bottom). There is not exact match for this subsection in the library but it is close.
If we take the average red, green, and blue pixel value for each image we can use three numbers to describe the general color in each image. Therefore, to find the tile that fits in each subsection we need to find the tile with the same average RGB pixel values. We can first start by creating a list of average RGB pixel values for each subsection in the cover image. We can then make a list of average RGB pixel values from our library of tile photos. Once the two list are created we can iterate over the subsection list and search the library of tiles list to find matching average RGB pixel values. Using clever dynamic programming and efficient data structures this search can be performed relatively fast. There is a major flaw with this approach that needs to be addressed however. It may be the case that your library of tile images is incomplete and not every average RGB pixel value is represented. Therefore, a search for the tile with the exact average RGB value will result in nothing, see Figure 2. The solution would be to find the next tile with the closest matching average RGB value. Extensive research has gone into determining “closeness” with respect to colors. For example, it is well understood that the colors black and white are not close at all. Our solution, however, is a simple one and it utilizes machine learning.
Closest Color with K-Nearest Neighbors
Each subsection and tile are represented by three numbers for the average red, green, and blue colors values. We can think of the three color values as a separate dimension and thus, we can create a 3D plot where each color is a dimension or axis. If we plot the values of the subsection, for which we are looking for a matching tile, with possible tiles in our library we can see which tiles have the closest color values.
Figure 3: The average RGB value for the subsection is plotted in red. Tiles with close RGB values are plotted in orange. Using KNN we can find the nearest match shown with the yellow "X".
The KNN algorithm can evaluate all tiles in the library and model the average pixel value. Then when searching for matching tiles for each subsection, the model will return the closest neighbor or tile with the color values that match most closely. This search is illustrated in Figure 3. Using KNN is more robust than doing a brute force search for the exact value since there are instances where the exact value may not exist. Under the hood, KNN models can be built using a tree-like structure which makes searching or traversing it relatively efficient. As such, performance is also comparable to other solutions that we have mentioned. Once all the tiles are found for each subsection color, simple array/matrix indexing can be used to stitch together all the tile images to create the final mosaic of the cover photo.
Closing
If you would like your own photo mosaic or need help building your one, please feel free to reach out. We can repurpose your old images that are collecting dust on some hard drive somewhere and give them a second chance at something beautiful.neighbors. Hey maybe they can even become NFTs!
Let’s look at another example photo mosaic with a different animation. All animations are made programmatically and will be detailed in following post.
Disperse animation, Recommend watching in full screen
Code available upon reasonable request.